Overview of Reports
This topic describes report functions, types, and data sources.
Report Functions
Reports display trends and rankings of the traffic volume, number of threats, and number of URL accesses within a certain period of time in different dimensions. You can monitor users and applications with a large traffic volume and learn existing security vulnerabilities and network attack types based on reports. You can take protective measures against abnormal data based on report analysis, and thereby ensuring network security. Reports are classified into various types based on functions. Table 1 describes exclusive application scenarios of reports.
Type |
Functions |
Application Scenario |
|---|---|---|
Traffic report |
Measure the traffic trend and top rankings within a specified period of time. |
Traffic reports show traffic trends measured based on the source address, destination address, application, and user dimensions, and help you learn the traffic status of the current network. For example, you can learn the volume of traffic generated by a source address and top applications occupying bandwidth resources. Upon discovering traffic anomalies in certain dimensions, you can limit the traffic volume by setting bandwidth management policies, to ensure normal use of bandwidth resources. |
Threat report |
Measure the threat trend and top rankings within a specified period of time. |
Threat reports show the trends of network attacks, intrusions, viruses, zombie, Trojan horses, and worms, and the affected intranet users. You can learn the latest threat types and active attackers based on threat reports. Upon discovering attacks, you can block the attacks on the FW or directly isolate affected hosts on the PC. |
URL report |
Measure the URL access trend and top rankings within a specified period of time. |
URL reports show URL sites that are frequently visited by intranet users and the corresponding URL classification. |
Policy matching report |
Measure the trend of the number of security policy matching times in a certain period of time and the top rankings. |
Policy matching reports show security policy matching situations. |
File blocking report |
Measure the trend of the number of file blocking policy matching times in a certain period of time and the top ones. |
File blocking reports show types of files that are frequently transferred by users. |
Data filtering report |
Measure the trend of the number of keyword matching times in a certain period of time and the top rankings. |
Data filtering reports show keywords that are frequently used by users in files and applications. |
Smart report search |
Measure the traffic status, threat trend, and top N ranking within a given time range based on a search condition. |
Smart report search displays comprehensive information, such as the traffic status and threat posture, based on a search condition on the web UI. |
Customized report |
Measure the trend and top N ranking within a given time range in a customized traffic report or comprehensive report. |
Customized reports display information about users' flexibly customizing traffic reports and comprehensive reports and generating report data as required. |
Data Source
All data in most reports comes from logs.When traffic arrives at or passes through the FW, the FW records various types of logs in the storage medium. The device generates reports based on logs every once in a while. The following figure shows the mapping between reports and logs.
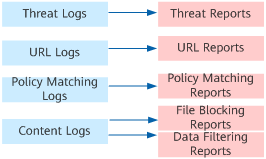
File-related data in content logs is used to generate file blocking reports and generate data filtering reports in conjunction with keyword-related data.
Traffic reports are not generated based on traffic logs. Instead, traffic reports are generated based on statistics in sessions periodically. If applications have been identified, traffic reports are generated periodically. If applications have not been identified, traffic reports are generated only when sessions age.