Basic Operations
The web UI of each type of report provides basic operation functions. The operation methods of these functions are common. You can switch between diagrams and achieve accurate search by setting time or dimension filtering conditions.
Functional Areas
On the web UI of reports, you can select report dimensions, set search conditions, and define diagram types. The following table shows the functions of each area on the web UI.
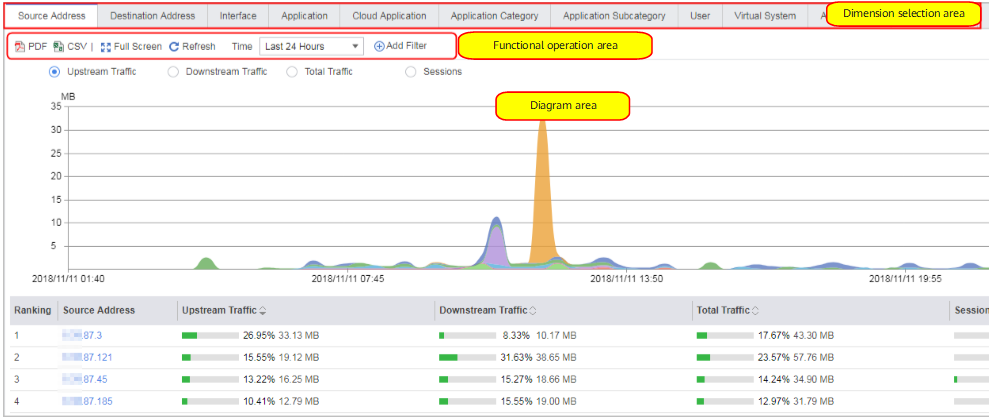
Table 1 Functional areas on the web UIArea
|
Description
|
|---|
Dimension selection area
|
In this area, you can select the dimension for displaying reports. After a dimension is selected, the web UI displays top rankings based on this dimension.
|
Functional operation area
|
In this area, you can export data, refresh a page, set a filtering time range, and perform advanced search. The operations are as follows:
- Exporting reports: You can export the report data in CSV format by clicking
 .and export the report data in PDF format by clicking .and export the report data in PDF format by clicking  to facilitate offline data checking. to facilitate offline data checking. - Full screen: You can hide the navigation tree, menu bar, and CLI console to display a report in full screen mode.
- Refreshing a page: After data on the current page is configured, you must click Refresh. Otherwise, the report data is not updated on the current page.
- Filtering time range: You can set the time range for checking historical report data. Currently, you can view report data generated within the last 1 hour, 24 hours, 3 days, 1 week, and 1 month, and user-defined range. To define a time range, manually enter Start time and End time. Ensure that the maximum time range does not exceed one month and that the minimum time range is no smaller than 30 minutes.
Each time point is subject to the current time. For example, when you query the report data generated within the last 24 hours, the system displays the report data generated within 24 hours subject to the current time.
- Advanced search: The FW supports data filtering for the current report based on search conditions. You can click Add Filter and select the search conditions to perform advanced search. If you need to accurately query certain report data, you can select multiple filtering conditions. After searching, you can click
 to clear selected search conditions. to clear selected search conditions.
|
Diagram area
|
This area displays diagrams of report data, including the following functions: - Selecting top ranking dimensions: Only traffic reports support this module. You can rank top ones in dimensions such as upstream traffic, downstream traffic, total traffic, and number of sessions. For example, if you select the upstream traffic dimension, the ranking area displays top ones ranked based on upstream traffic.
- Switching between diagrams: Report data can be present in superposition diagrams, stacking chart, curve chart, bar chart and pie charts. You can define the desired form. The superposition diagram is used as an example to introduce the report UI.
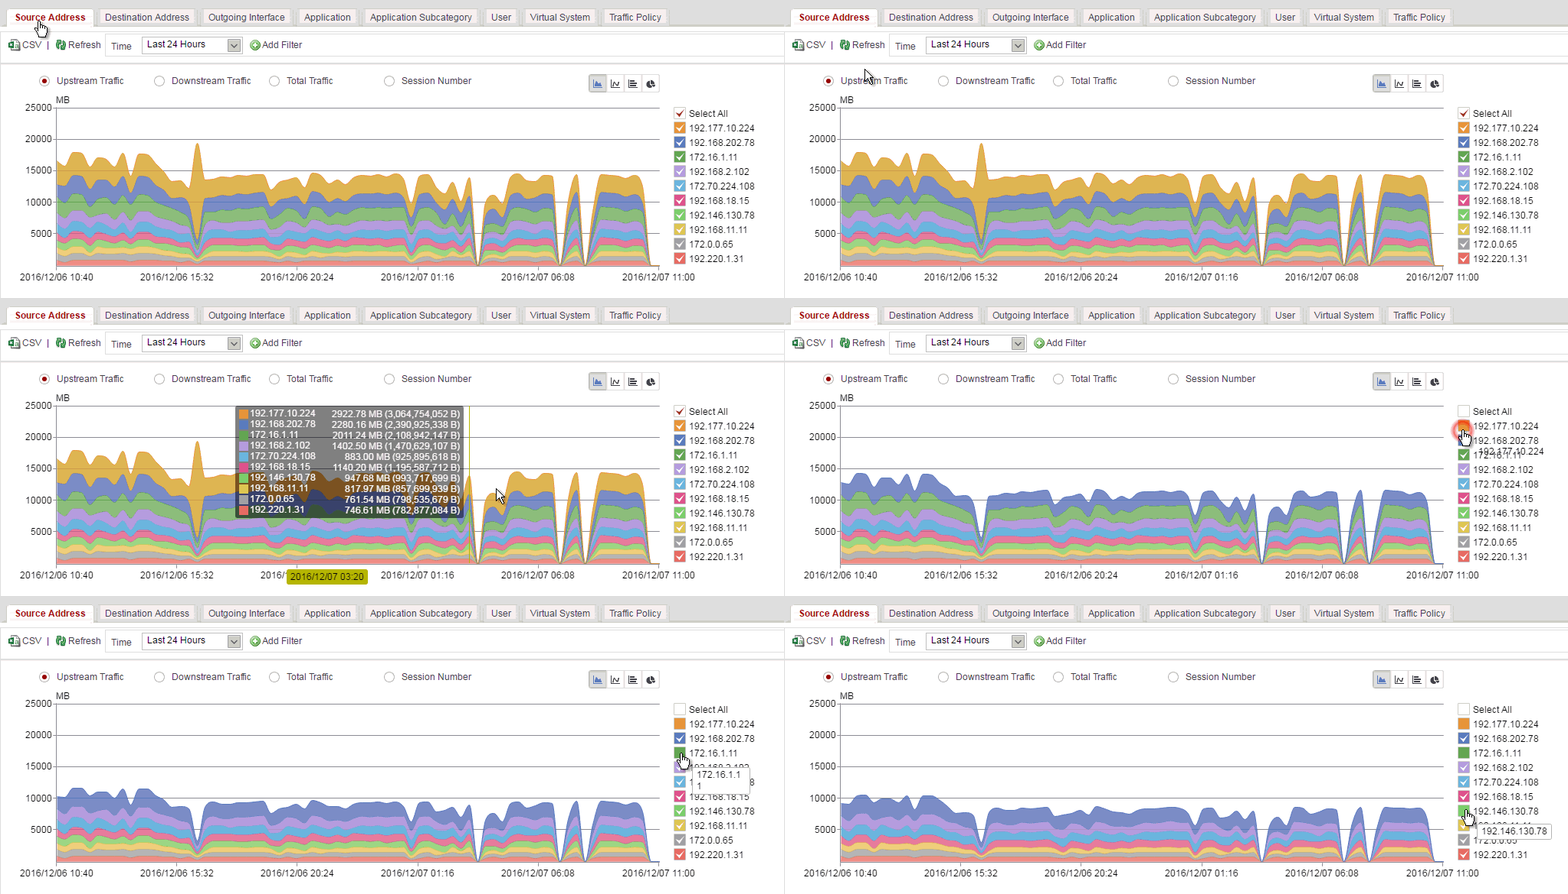
- Defining top N to be displayed: By default, top 10 of the data are displayed. You can deselect certain options to filter certain data that is not required.
- Displaying top rankings: You can view top rankings in a certain dimension, upstream traffic, downstream traffic, total traffic, and number of sessions in the ranking area.
- Secondary data drilling: You can the link corresponding to desired data to view the top rankings of the data in a specific dimension. The report data drilled secondarily support the advanced query function. User-defined report data can be generated based on the advanced query condition.
|
Table 1 describes functions of each area on the web UI. This section describes two types of interactive operations of reports.
User-defined Diagram Switching
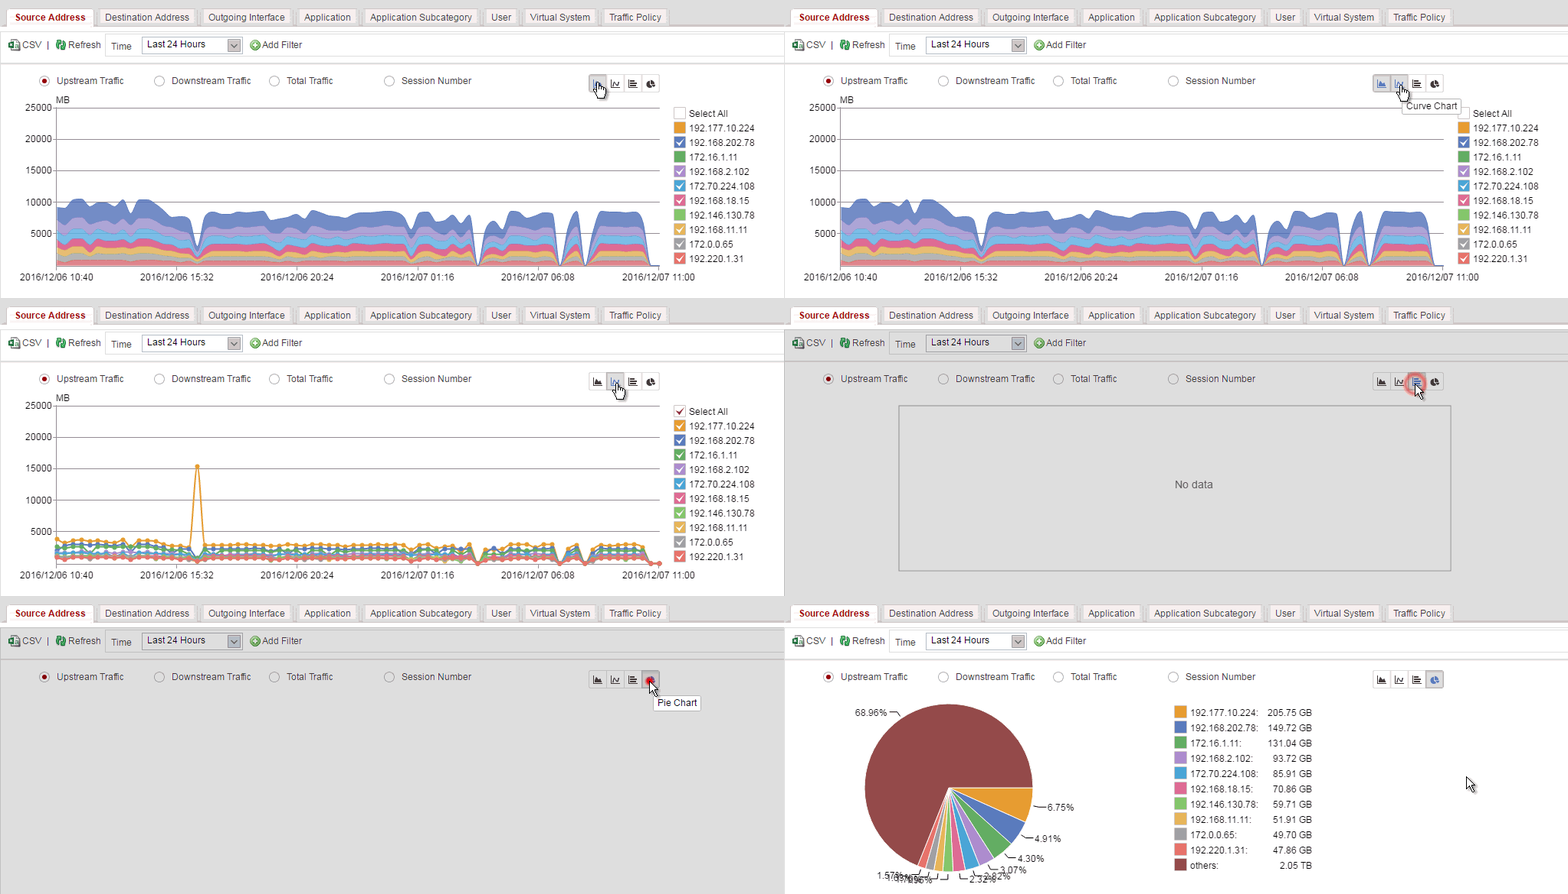
The FW report can display data through a stacking chart, curve chart, column chart, or pie chart. The stacking chart, pie chart, and column chart make it convenient for you to compare traffic usage per IP address, and the curve chart displays the traffic usage thread for a specific IP address. The switching between multiple charts provides better visual experience for users. By default, a stacking chart is used to display data. You can define the chart as shown in the following figure.
User-defined Top N Data
By default, the diagram area displays top 10 data. You can deselect certain options to filter certain data that is not required, as shown in the following figure.