Visualized Management
This section describes how to use the visualized management center.
The visualized management center allows you to select an interface, internal server, or VPN service to configure them, check the network topology, view the network status from the topology, and check and diagnose the device.
Prerequisites
The network planning has been complete.
You have familiarized yourself with the neighboring devices, service models, traffic directions, inside and outside interfaces, and IP addresses, if the networking and service configuration have been complete.
Before using this function, ensure that the current administrator has the read and write permissions of the visualized management center. If the administrator does not have the required permissions, the system administrator must grant the permissions to the administrator. Log in to the web UI as the system administrator, choose , click  , and change the permission under Permission to Read/Write. The system administrator has the read and write permissions by default. Therefore, this step can be skipped for the system administrator.
Networking
The networking diagram is the basis of the visualized management center, which allows you to select an interface, internal server, or VPN service to configure them or check the network topology.
- Choose .
- Click Configure Networking Diagram.
- In the page that is displayed, select VPN service, Internal server, LAN interface, or WAN Interface based on the planning or the actual networking.
In the Internal server and LAN interface drop-down lists, select the interfaces to be monitored. If the interface is not configured, click OK in the page that is displayed and configure the interface. For details, see Configuring Interfaces.
- Optional: Click
 and repeat the preceding steps to configure more interfaces. You can configure six inside interfaces (intranet interfaces) and eight outside interfaces (Internet interfaces) on the device.
 - Click OK. The networking diagram configuration is complete.
Device Operating Status
You can move the pointer to an area icon in the networking diagram to view the status of devices, interfaces, server mappings, and VPN services. For details about the areas, see Figure 1.
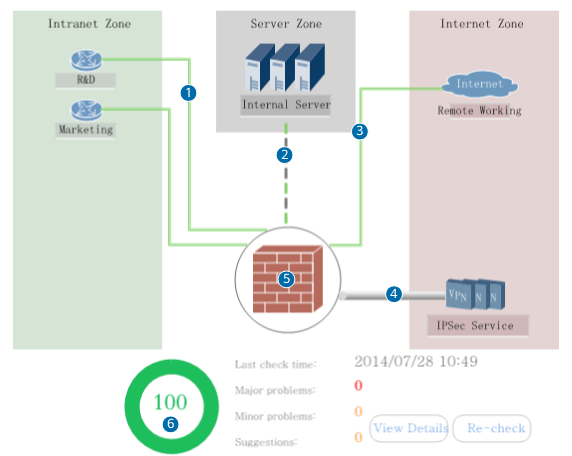
Interface information and traffic transmission status
Move the pointer to area 1 or 3, information, such as the current interface name, IP address, inbound traffic, and outbound traffic, is displayed.
You can also click Legend and check the traffic status indicated by each color.
Server transmission status information
Move the pointer to area 2, information, such as the current number of sessions of the server and inbound traffic, is displayed.
Basic information about VPN service
Move the pointer to area 4, information, such as the number of received and sent IPSec packets for the current service and the number of the established tunnels, is displayed.
Device resource information
Move the pointer to area 5, you can check information, such as the current CPU usage of the data plane and the memory usage of the device.
Quick Configuration
You can complete basic configurations, change intranet and Internet interfaces, and create servers on the networking diagram. When the device or service is abnormal, you can collect information for diagnosis.
Basic configuration of the device
Move the pointer to area 5, click Startup Wizard, Update Center, License Management, or Diagnosis Info, and access the corresponding configuration page to complete the configuration. Details are as follows:
Item
Description
Startup Wizard
Helps you complete the basic device configuration and WAN access. For details, see Startup Wizard.
Update Center
Describes how to upgrade the signature database. For details, see Update Center.
License Management
Describes how to manage and activate a license. For details, see License Management.
Diagnosis Info
Displays the operating status and configuration information of each module of the device. You can export the collected information and send them to technical support personnel for fault locating.
Server mapping
Move the pointer to area 2, click Set, and access the Server Mapping List page. View the mapping information of the NAT server or click Add. Configure the server mapping. For details, see Configuring Server Mapping
Intranet interface/Internet interface
Move the pointer to area 1 or 3, click Set, and access the interface configuration page. For details, see Configuring Interfaces.