Traffic Map
The traffic map displays global traffic distribution with details, such as traffic rank, volume, direction, source IP address, and destination IP address.
Context
The supported traffic maps and the dependency between the traffic map and storage media on the USG6000E are as follows:
- For the USG6000E device except the USG6510E/6510E-POE and USG6530E, this window is always displayed, no matter whether the hard disk/SD card is available.
- For devices USG6510E/6510E-POE and USG6530E, this window is displayed only when the SD card is available.
The traffic map can display global distribution of traffic passing through the device by source region or destination region.
- The source region map displays the traffic distribution and volume of the source region.
- The destination region map displays the traffic distribution and volume of the destination region.

For versions earlier than V600R007C20SPC300, before querying traffic maps, you have run the log type traffic enable command to enable the recording of traffic logs. For V600R007C20SPC300 and later versions, also run the log type traffic-report enable command to enable the traffic report function.
If the region that IP addresses belong to is modified, the historical map displays information based on regions configured before the modification.
Virtual systems do not support this map customization function. You can contact the administrator for customization in the root system.
Procedure
- Choose .
- Select filtering conditions above the map as required.
Item
Description
TOPN
TOP N regions by traffic on the map, including TOP10 and TOP20.
Display dimension
Map display dimensions, including Source Region and Destination Region.
Traffic parameter
Traffic parameter displayed on the map, including Bytes and Sessions.
Statistics period
Statistics period by which the map is displayed. The period can be Today, Last Three Days, or Last Month.
Regions are displayed in different colors by traffic volume scale. For details, refer to the legend on the lower left of the map. In the following map displayed by source region, red marks the region where the device locates.
The following map is only an example.
Mechanism for displaying the regions of devices on the UI: The system checks the regions where the interfaces on the page reside. If the first interface IP address of the device is assigned to a specific region, the location of the device is displayed as the region of the interface address on the map. If the first interface IP address of the device is in an unknown region, the system continues to search for interfaces until it finds an interface in a fixed region, and the location of the device is displayed as the region of the interface address on the map. If none of the interfaces is assigned to a region, the system displays the longitude and latitude (0,0) of the device by default.
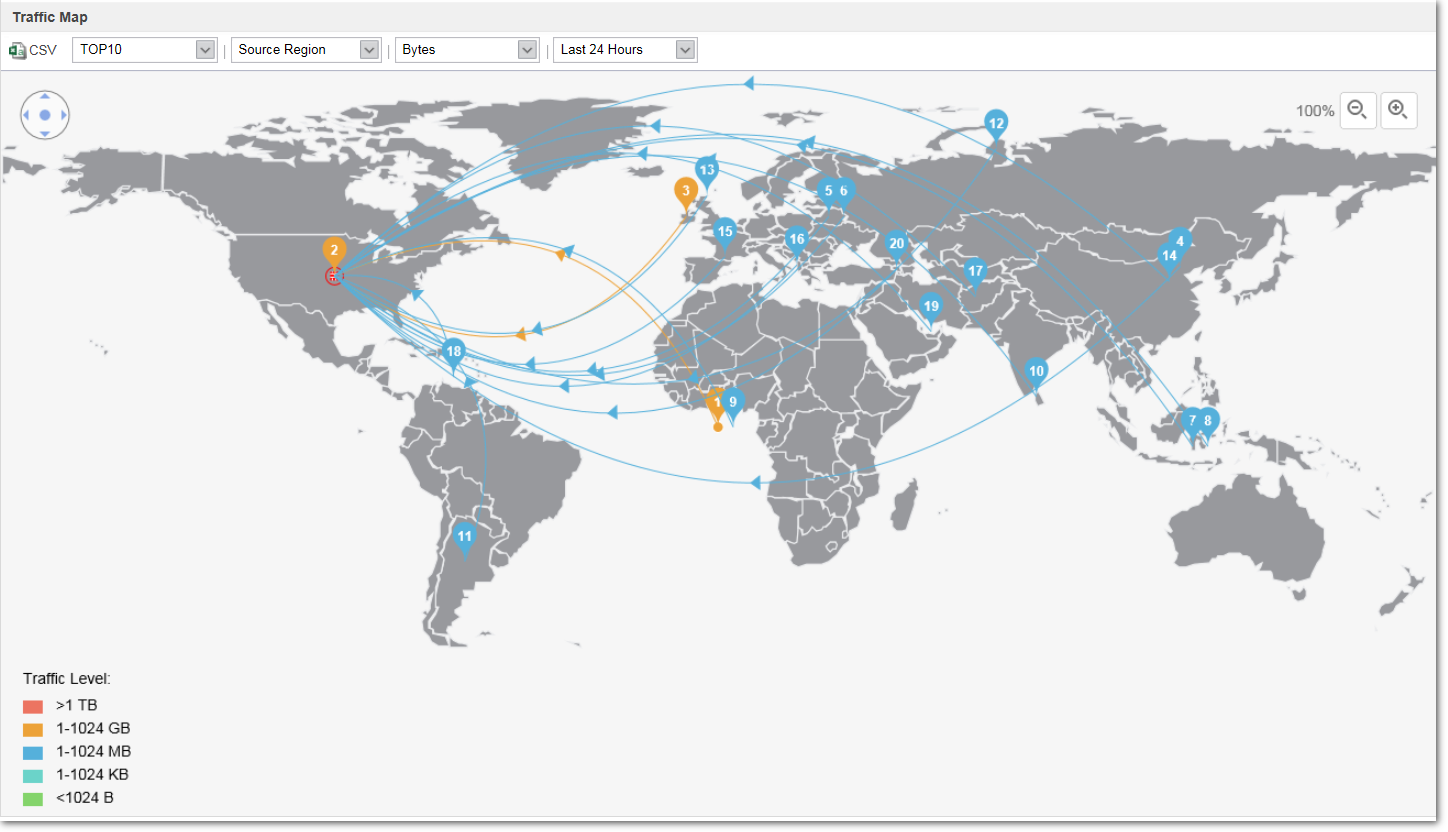
The total traffic volume of China is displayed by default. For provincial and municipal details, you can click China region to display China map.
Traffic statistics of unknown regions on the page are not included in traffic statistics of specified regions.
User-defined regions are displayed on the map only when the regions have traffic passing through. The location is determined by the configured longitude and latitude.
- Optional: You can click the pop-up digit on the map to display traffic details.
- View Source Address Ranking: displays traffic rank by source IP address. You can click a source IP address to display details of traffic from the source IP address.
- View Application Ranking: displays traffic rank by application.
- Optional: Click
 to export the traffic map data in CSV format so that you can view the map offline.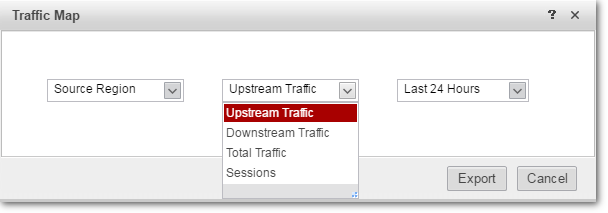
- Export based on the source area and time: Export the traffic or session number ranking of the source area in a specified period.
- Export based on the destination area and time: Export the traffic or session number ranking of the destination area in a specified period.
You can view the traffic data within predefined and user-defined time. As for user-defined time, you need to enter Start time and End time.
The FW supports the export of up to 10,000 traffic data entries.
This function is supported only when a hard disk is in position.
Follow-up Procedure
The information above is common map operations, and the information below is some guidance for further operations.
- If the enterprise deploys web and FTP servers for external access, you can display the map by source region to check which region initiates large amount of traffic and configure region-based Bandwidth Management. You can also click a region to display traffic rank by source IP address and details about source IP addresses.
- If you need to know the main regions and applications that employees access, you can display the map by destination region. You can also click a region to display traffic rank by application and details about applications and risks. You can configure a region-based or application-based Security Policy for threat defense.
If the location of some traffic data is incorrect, the IP address may be added to an incorrect region. You can add the IP address to the correct region.