Application Ranking by Real-Time Traffic
This window displays top 10 applications by real-time traffic.
You can view applications with the heaviest traffic in this window.
The real-time monitoring statistics can be displayed in two dimensions: device and virtual system. In the root system, you can view the real-time traffic statistics of the device (including the root system and all virtual systems) or the root system. In the virtual system, you can view the real-time traffic statistics of the current virtual system.
In the root system, click  to prompt the Application Ranking by Real-Time Traffic window, where you can enable or disable the real-time traffic monitoring function. When you enable real-time traffic monitoring, click the drop-down list of Scope, select All virtual systems or public as required, and set Type to Upstream, Downstream, Total, or Session.
In a virtual system, click to prompt the Application Ranking by Real-Time Traffic window, where you can enable or disable the real-time traffic monitoring function.
Table 1 describes the dimensions of real-time traffic statistics on applications.
Parameter |
Description |
|---|---|
up |
Upstream traffic: traffic transmitted in the application dimension |
down |
Downstream traffic: traffic received in the application dimension |
total |
Total traffic (sum of upstream and downstream traffic) |
session |
Number of sessions |

For top N IPv4 statistics, during ranking by traffic, the FW collects statistics on traffic processed by the SPU. Therefore, if hardware fast forwarding is enabled, and the ranking is based on traffic, statistics on traffic fast-forwarded cannot be collected. To collect statistics on all traffic, disable hardware fast forwarding first. IPv6 traffic does not support hardware fast forwarding; therefore, top N IPv6 statistics collection does not have this restriction.
If the ranking is based on sessions, statistics collection is not affected by the hardware fast forwarding function. This is because that sessions are created on the MPU, regardless of whether hardware fast forwarding is enabled.
This topic uses top 10 applications by device total traffic as an example to show real-time statistics.
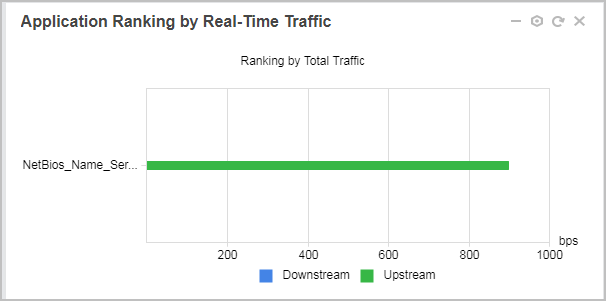
By default, the real-time monitoring function is disabled. To use it, click Enable.
Real-time monitoring consumes a lot of device resources. Therefore, enable this function with caution. Disable this function immediately after using it.
You can click the bar chart of an application in the preceding diagram to view general data of this application, namely, historical traffic data of this application filtered based on user-defined time. You can also view data of this application drilled from such dimensions as the user dimension.
Only devices with hard disks support overview data statistics.
Summary data based on application indicates historical traffic statistics and requires some time to collect. Therefore, the real-time traffic data of some applications may be large, but no information is displayed on the page after you click View Details. A possible cause is that the historical statistics collection time is not reached or the traffic volume in the historical time range is too small. This is a normal situation.