CLI: Example for Sending Region Traffic Logs to the eLog Log Host
You can learn traffic distribution in different regions of the eLog by checking region traffic logs on the eLog.
Networking Requirement
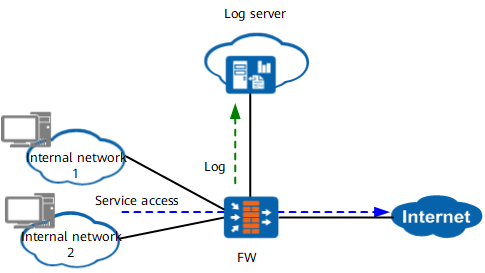
As shown in Figure 1, the FW is deployed as a gateway on the network boundary. Security policies are configured for the FW to control packets accessing the external network from the internal network.
You need to configure two regions, corresponding to internal network 1 and international network 2, on the eLog, and check traffic distribution in different regions.
Configuration Procedure
To fulfill the preceding requirement, configure the system as follows:
- On the FW, configure the function of outputting session logs, configure interworking parameters, and output logs to the eLog.
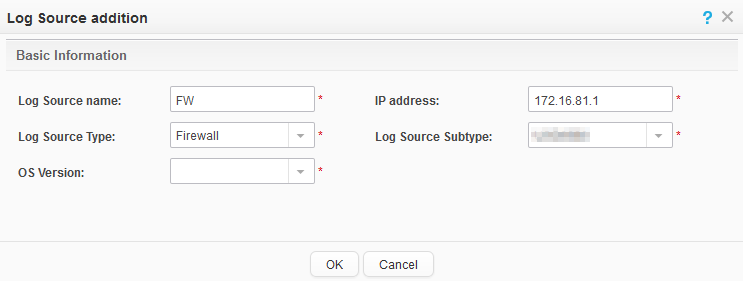
- Ensure that the eLog has been installed. On the eLog, discover the log source (FW), and associate the system with the collector and log source.
Data Planning
Table 1 describes data planning for the FW and eLog.
Data Planning on the FW |
Data Planning on the eLog |
Description |
||
|---|---|---|---|---|
Interface and IP Address |
Security Policy |
IP Address |
Collection Mode |
|
Interface interworking with the eLog: GigabitEthernet 0/0/1 Security zone: DMZ IP address: 172.16.81.1/16 |
Security policy for service traffic:
|
172.16.110.168 |
Collection mode: Session Port: 9002 |
The eLog collects logs over port 9002 in session mode. |
Procedure
- Important check items before configuration
Before configuring the FW and eLog, pay attention to the following important check items and complete the configuration based on the actual situation:
The time zone and time of the FW shall be the same as those of the eLog.
If the time zone or time of the FW is different from that of the eLog collector, log query results will be affected. You are advised to use NTP to make the FW and eLog as the clients to synchronize time from the clock source. If NTP is not deployed on the network, you can manually adjust the time on the FW to ensure time consistency between the FW and eLog.
Specify the method of managing the log source (that is, the FW) on the eLog.
Currently, the eLog supports two FW management methods: manual adding and automatic discovery. You are advised to manually add the FW because this method is simple and you do not need to perform extra configuration on the FW. When there are a large number of FW, you can use the other method, automatic discovery. If this method is used, you need to set SNMP parameters on the FW.
- Configure the FW.
Check whether the time zone and time of the FW are the same as those of the eLog collector. In the case of inconsistency, run the following commands to adjust the time zone or time of the FW.
# Adjust the time zone of theFW to keep consistency with that of the eLog collector. Assume that the eLog collector is in the Beijing time zone. The time of the collector is 8 hours earlier than Universal Time Coordinated (UTC). Use the add 08:00:00 parameter. If the eLog collector is in a time zone where the time is later than UTC, use the minus parameter.
<FW> clock timezone BJ add 08:00:00# Adjust the time of the FW to keep consistency with that of the eLog collector. Assume that the current time of the eLog collector is 00:00:00 on December 1, 2018.
<FW> clock datetime 0:0:0 2018/12/01After the preceding configuration, run the display clock command to view configuration results.
<FW> display clock
2018-12-01 00:00:06
Tuesday
Time Zone(Default Zone Name) : UTC
Daylight saving time :
         Name        : utc
         Repeat mode : repeat
         Start year  : 2011
         End year    : 2018
         Start time  : 01-01 12:11:00
         End time    : 12-04 01:00:00
         Saving time : 01:00:00
If the eLog manages FW through automatic discovery, SNMP parameters must be configured on the FW. However, if the eLog manages FW through manual adding, skip this step.
# Configure SNMP parameters on FW, so that they can be automatically discovered by the eLog. As SNMPv3 is securer than SNMPv1 or SNMPv2c, you are advised to use SNMPv3. At the same time, you are advised to use SHA2-256 as the authentication protocol and AES128 as the encryption protocol.
<FW> system-view
[FW] snmp-agent sys-info version v3
[FW] snmp-agent group v3 group privacy
[FW] snmp-agent usm-user v3 admin group group
[FW] snmp-agent usm-user v3 admin authentication-mode sha2-256
Please configure the authentication password (8-64)
Enter Password:
Confirm Password:
[FW] snmp-agent usm-user v3 admin privacy-mode aes128
Please configure the authentication password (8-64)
Enter Password:
Confirm Password:
Complete the basic configuration such as the configuration of the IP address and security zone of the interface.
# Configure the IP address of the interface and assign the interface to the security zone. Here the interface connecting the firewall to the eLog is taken as an example. If the firewall and eLog belong to different networks, configure a route on the firewall to the eLog.
[FW] interface GigabitEthernet 0/0/1
[FW-GigabitEthernet 0/0/1] ip address 172.16.81.1 16
[FW-GigabitEthernet 0/0/1] quit
[FW] firewall zone dmz
[FW-zone-dmz] add interface GigabitEthernet 0/0/1
[FW-zone-dmz] quit

If the eLog manages firewalls through automatic discovery, you need to run the service-manage SNMP permit command to enable the access permission on SNMP after running the ip address 172.16.81.1 16 command; if the eLog manages firewalls through manual adding, you do not need to run the command.
- Configure the security policy.
# Configure the security policy for service traffic.
[FW] security-policy
[FW-policy-security] rule name policy1
[FW-policy-security-rule-policy1] source-zone trust
[FW-policy-security-rule-policy1] destination-zone untrust
[FW-policy-security-rule-policy1] source-address 192.168.0.0 24
[FW-policy-security-rule-policy1] source-address 192.168.1.0 24
[FW-policy-security-rule-policy1] action permit
[FW-policy-security-rule-policy1] quit
- Configure the log host.
# Set the IP address of the log host to 172.16.110.168 and port to 9002. (the eLog adopts the session mode to collect logs.)
[FW] firewall log host 1 172.16.110.168 9002 - Configure the source address and source port to be used by the firewall for sending service logs.
[FW] firewall log source 172.16.81.1 6666 Enable the session log function.
# Enable the record function for session logs in the security policy for service traffic.
[FW] security-policy
[FW-policy-security] rule name policy1
[FWW-policy-security-rule-policy1] session logging
[FW-policy-security-rule-policy1] quit
[FW-policy-security] quit
Configuration commands vary depending on product patterns and versions. This section describes configuration commands for different product patterns and versions.
- Configure the eLog.
- Select the log source management method, manual adding or automatic discovery. Manual adding is recommended.
Manage log sources by automatically discovering them:
Click
 and set the following parameters. The authentication and authorization protocol and password as well as the data encryption protocol and password must be consistent with the configuration on the FW.
If there are many log sources on the network and these log sources are configured with the same SNMP parameters, you can create an SNMP parameter template on the eLog in advance, set the automatic discovery mode, and reference the SNMP parameter template to reduce the configuration workload.
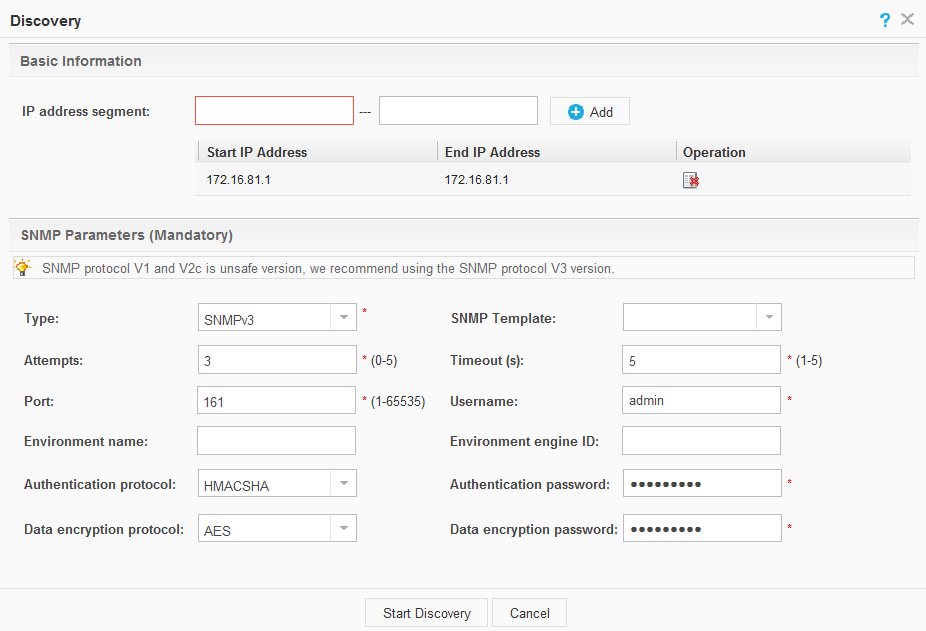
- Click Start Discovery.
- After discovery is complete, the discovery result shows information about discovered log sources. In the Discovery Result dialog box, click Close.
- Click
 next to the collector. Then click
  in the Operation column of the collector.
The collector configuration window is displayed.
- Click
 .
. - Select log sources to be associated, as shown in the following figure:
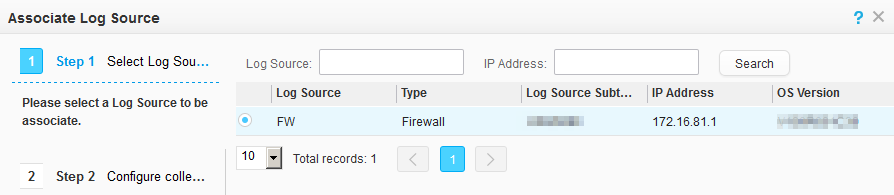
- Click Next. Configure the log collection mode.
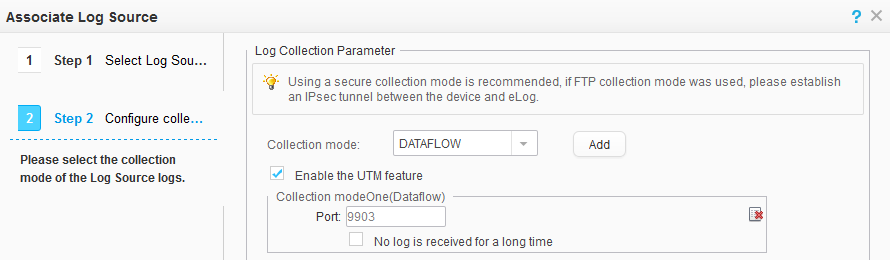
Configure the log collection mode on the eLog, select DATAFLOW, and set the port number to 9903. If the FW supports the UTM feature, select Enable the UTM feature.
Take the USG6000E as an example. The configuration is shown in the following figure.
- Click
 . Configure zone1.
Region name
zone1
IP Range
192.168.0.1-192.168.0.254
- Select the log source management method, manual adding or automatic discovery. Manual adding is recommended.

Checking Log Information
After the preceding configuration is complete, when traffic generated for the access to the external network from the internal network, the FW generates session logs and outputs the logs to the eLog. You can view the region traffic logs on the eLog.
- Choose and enable Session Statistic. Then, you can view the Zone Traffic page on the web UI.
- Choose .
Set an appropriate query time range, and click Search. The query result is shown in the following figure. The log information is only exemplary. Log information varies depending on actual network environments.
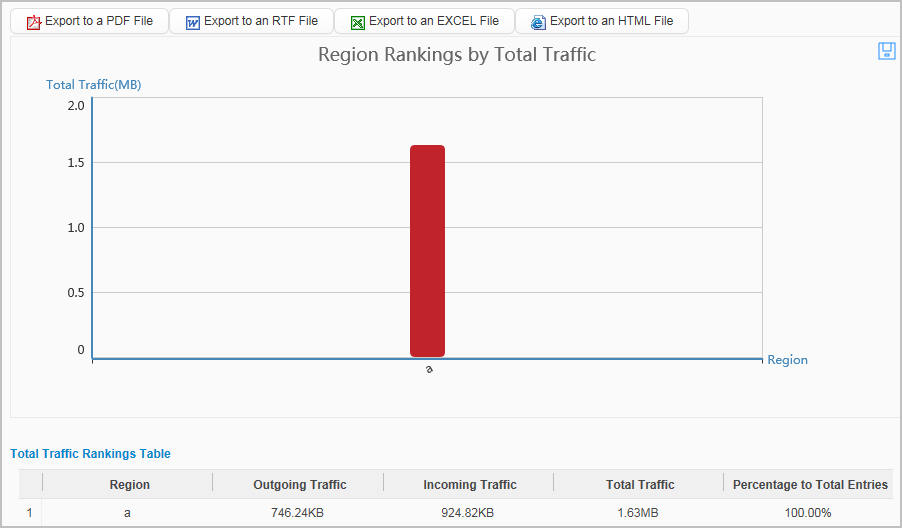
The query result displays the traffic in each region in a bar graph. In this way, you can traffic distribution and rankings in each region in a timely manner.
Configuration Script
This example provides configuration scripts only related to the cooperation between the FW and the eLog.
#
 sysname FW
#
 firewall log host 1 172.16.110.168 9002
 firewall log source 172.16.81.1 6666
#
interface GigabitEthernet 0/0/1
 ip address 172.16.81.1 255.255.0.0
#
firewall zone dmz
 set priority 50
 add interface GigabitEthernet 0/0/1
#
 snmp-agent
 snmp-agent sys-info version v3
 snmp-agent group v3 group privacy
 snmp-agent usm-user v3 admin group group
 snmp-agent usm-user v3 admin authentication-mode sha2-256 cipher %^%#ZgL-L2HsZ<5P]s+:6d)LcBG5)~mdl=te
 snmp-agent usm-user v3 admin privacy-mode aes128 cipher %^%#i!rs46cpF"_)d#.cJ,'1>wE_>wE
#
security-policy
 rule name policy1
  session logging
  source-zone trust
  destination-zone untrust
  source-address 192.168.0.0 mask 255.255.255.0
  source-address 192.168.1.0 mask 255.255.255.0
  action permit
#
return