Viewing Traffic Reports in the User Dimension
This topic describes how to view traffic reports in the user dimension.
You can view the status of traffic sent or received by a user or the trend of traffic generated for accessing an application by a user in the traffic reports in the user dimension.
Viewing Reports
To view the traffic report in the user dimension, click the User tab.
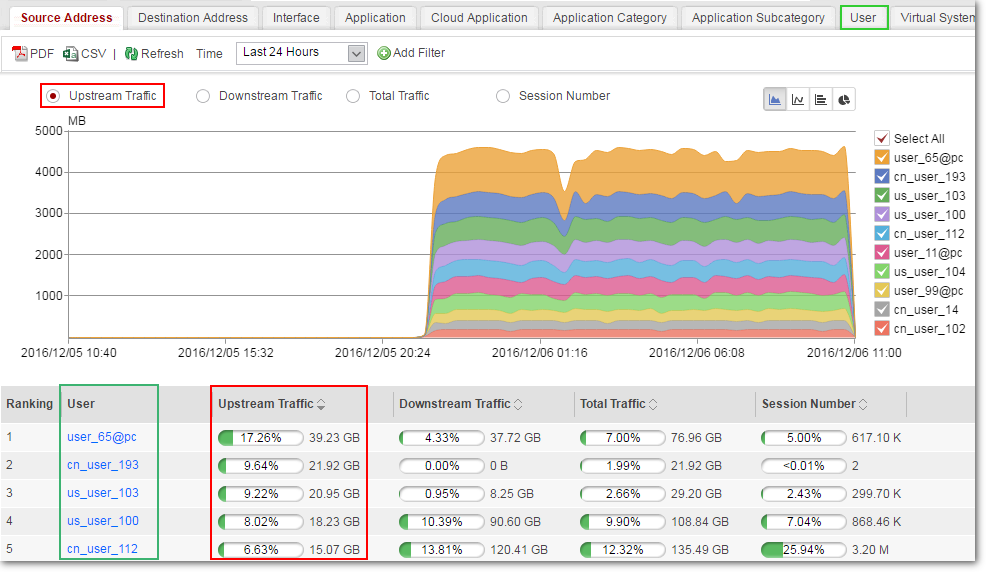

The data measured in the user traffic reports is the data of users who have been verified on the device. The data of non-verified users is not measured in the reports.
Customizing Generated Reports
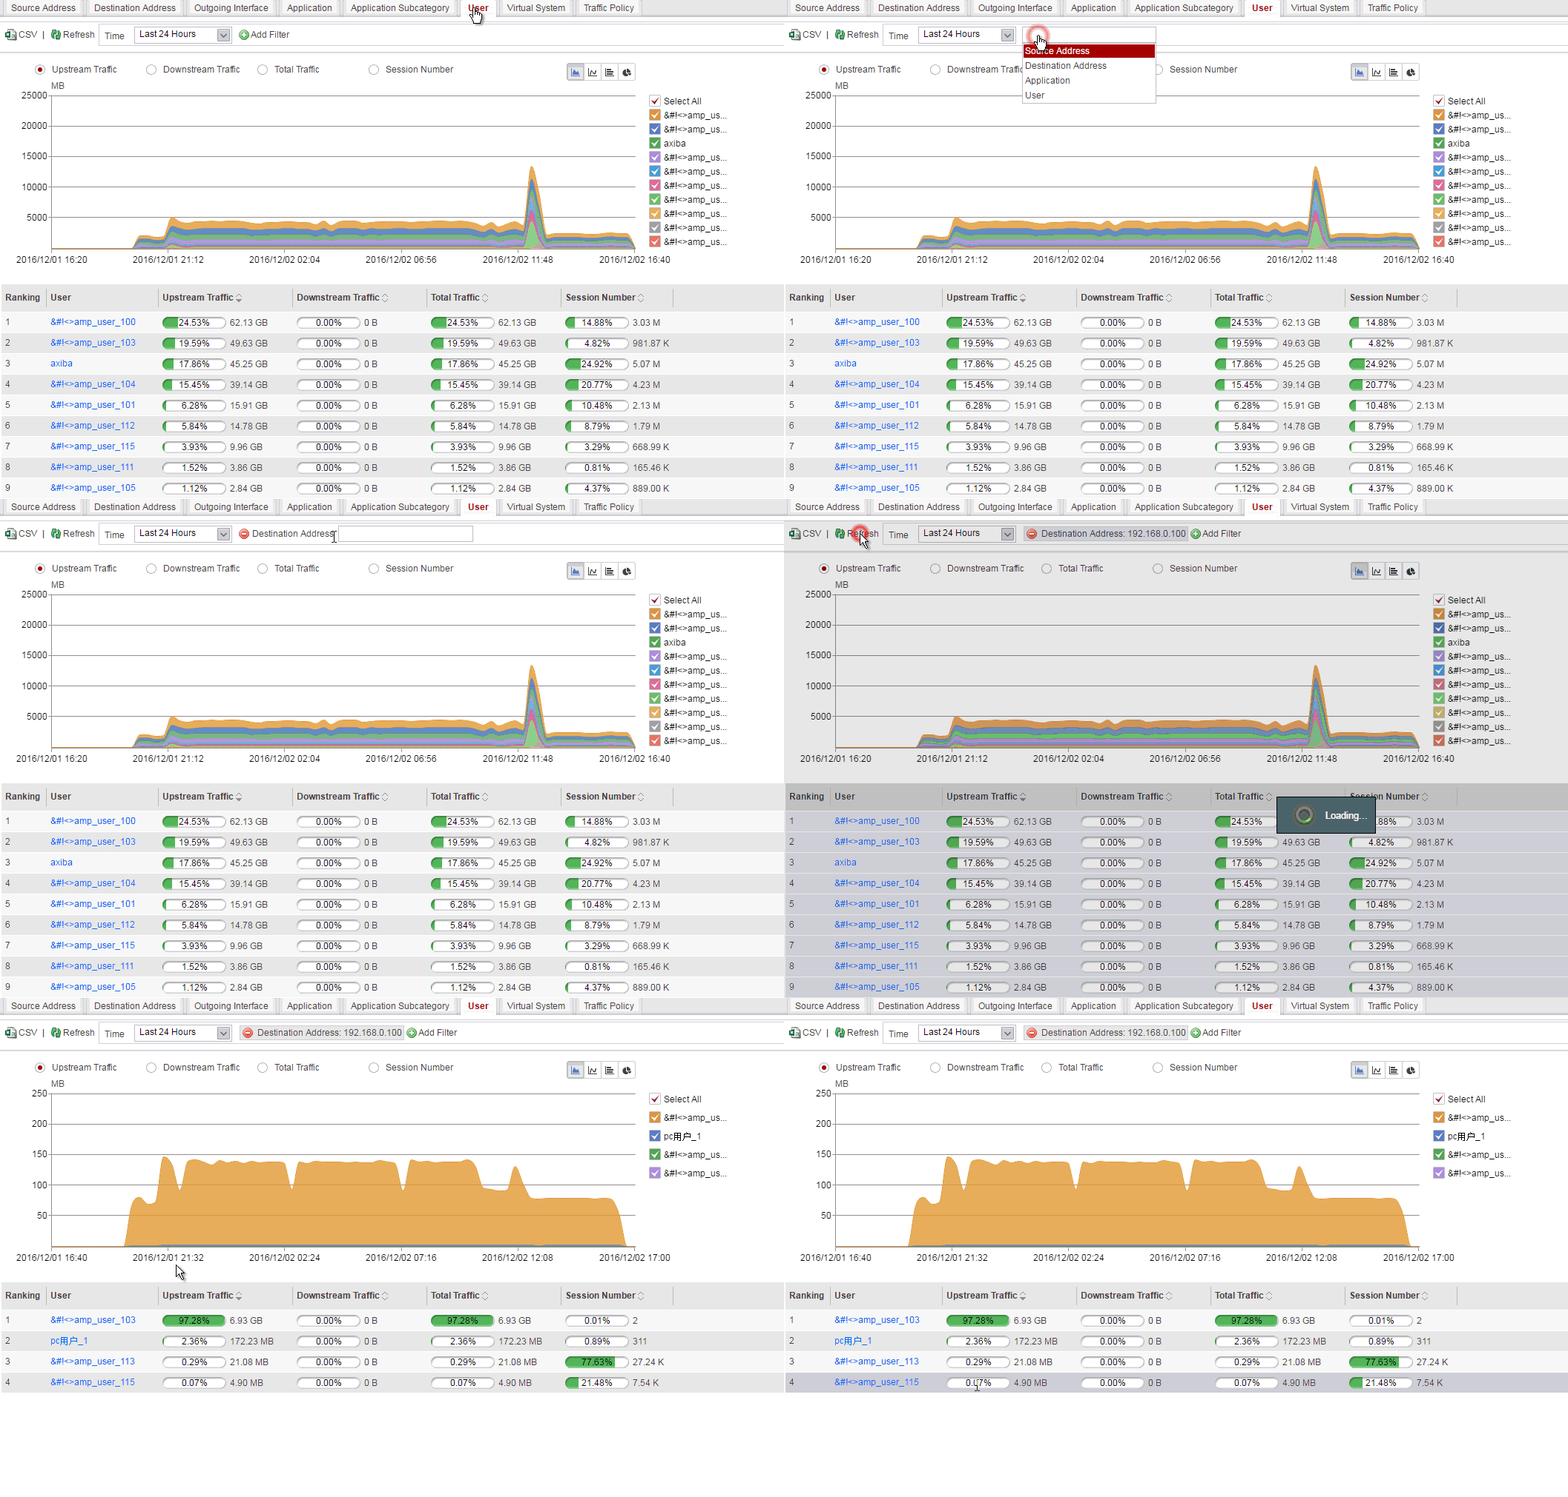
You can narrow the search range to view traffic statistics in a specific dimension using the advanced search function. To customize generated reports, specify one or more search conditions in Add Filter, and click Refresh.
For example, the following figure shows specific operations and displayed data for comparing traffic generated by users who visit destination address 192.168.0.100.
Drilling Traffic in the Application Dimension
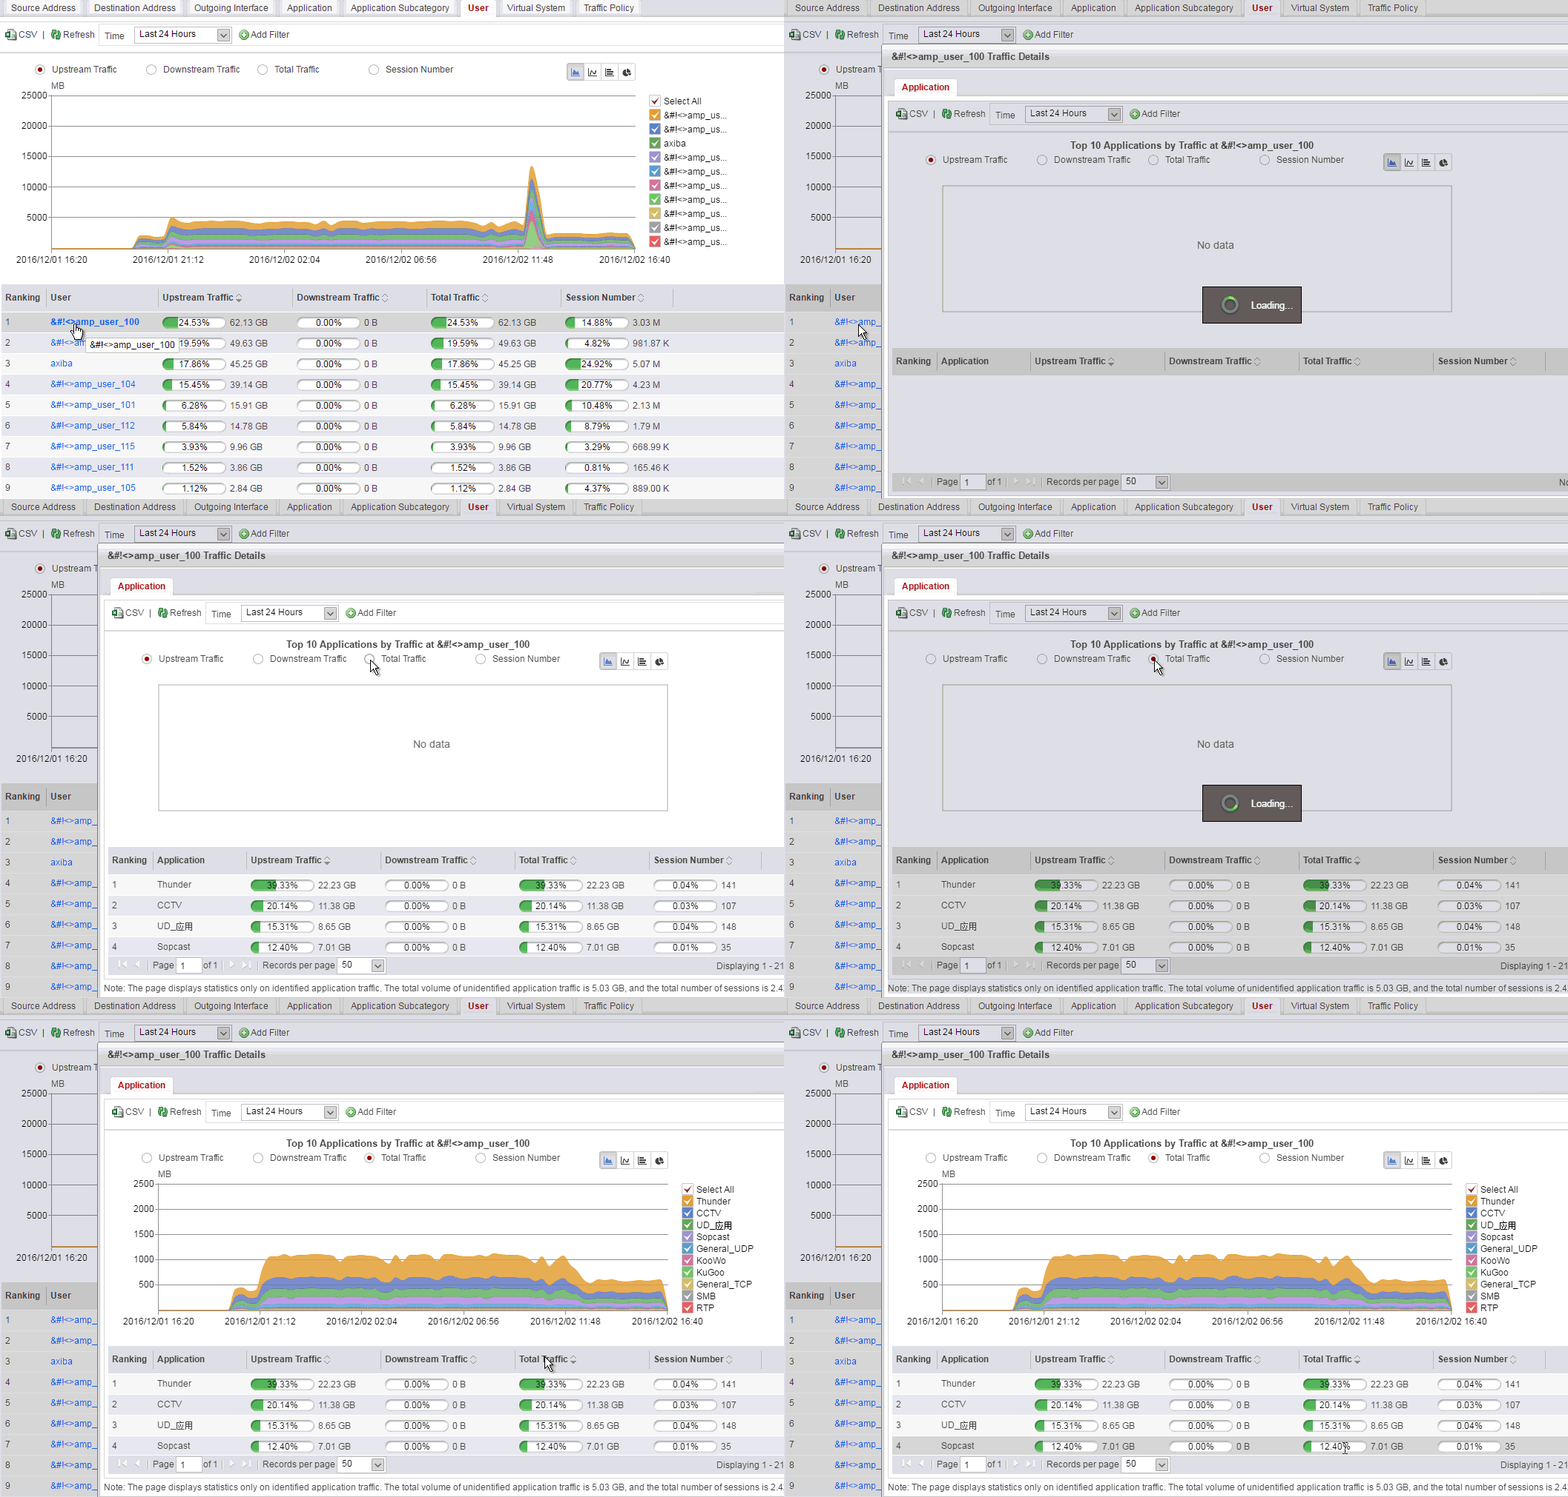
Only the USG6000E (not including USG6510E/6510E-POE/6530E) support this function.You can drill the application dimension for certain user traffic. To view traffic of an application, you can click a data link.
For example, if the volume of traffic generated by a certain user is extremely high, you can view the application traffic trend corresponding to this user. The following figure shows the specific operations and displayed information.
If the traffic of non-critical services such as P2P or online video is high and affects normal services, you can limit the traffic by setting bandwidth management policies, to ensure normal use of bandwidth resources.