Viewing Traffic Reports in the Application, Application Category or Application Sub-category Dimension
This section describes how to view traffic reports in the application or application sub-category dimension.
You can view the trend of traffic generated for an application, application category or an application sub-category in the traffic reports in the application or application sub-category dimension.

In a scenario where the application identification mode is intelligent identification, the FW performs application identification on traffic that matches a policy only when the policy has application identification or content security detection configured. If the application identification mode is full identification, the FW performs application identification on all traffic. If the service traffic has no application information, configure the application in the policy or set Application Identification Mode to Full Identification. Otherwise, reports from the application dimension are not generated. You can use the sa force-detection enable command to configure the application identification mode.
Viewing Reports
To view traffic reports in the application or application sub-category dimension, click the Application/Application Subcategory tab. The methods for viewing traffic reports in the application and application sub-category dimensions are the same. This section uses the application dimension as an example to describe how to view the traffic reports.
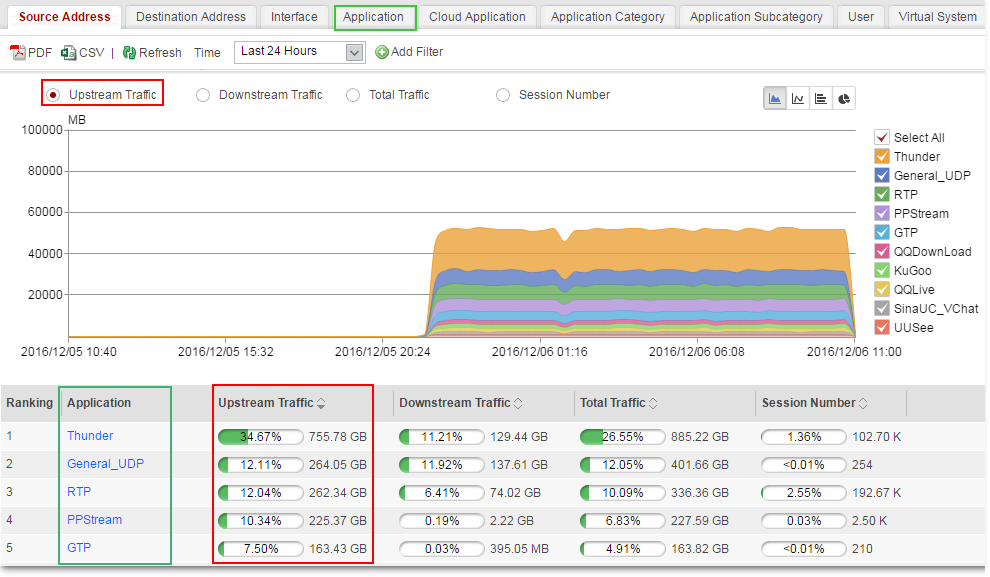
The data measured in the application traffic reports is the data of applications identified by the service awareness signature database. The data of applications that cannot be identified by the service awareness signature database is not measured in the traffic reports.
The traffic report shows the historical statistics by default. You can also view real-time traffic statistics of applications. For details, see .
Customizing Generated Reports
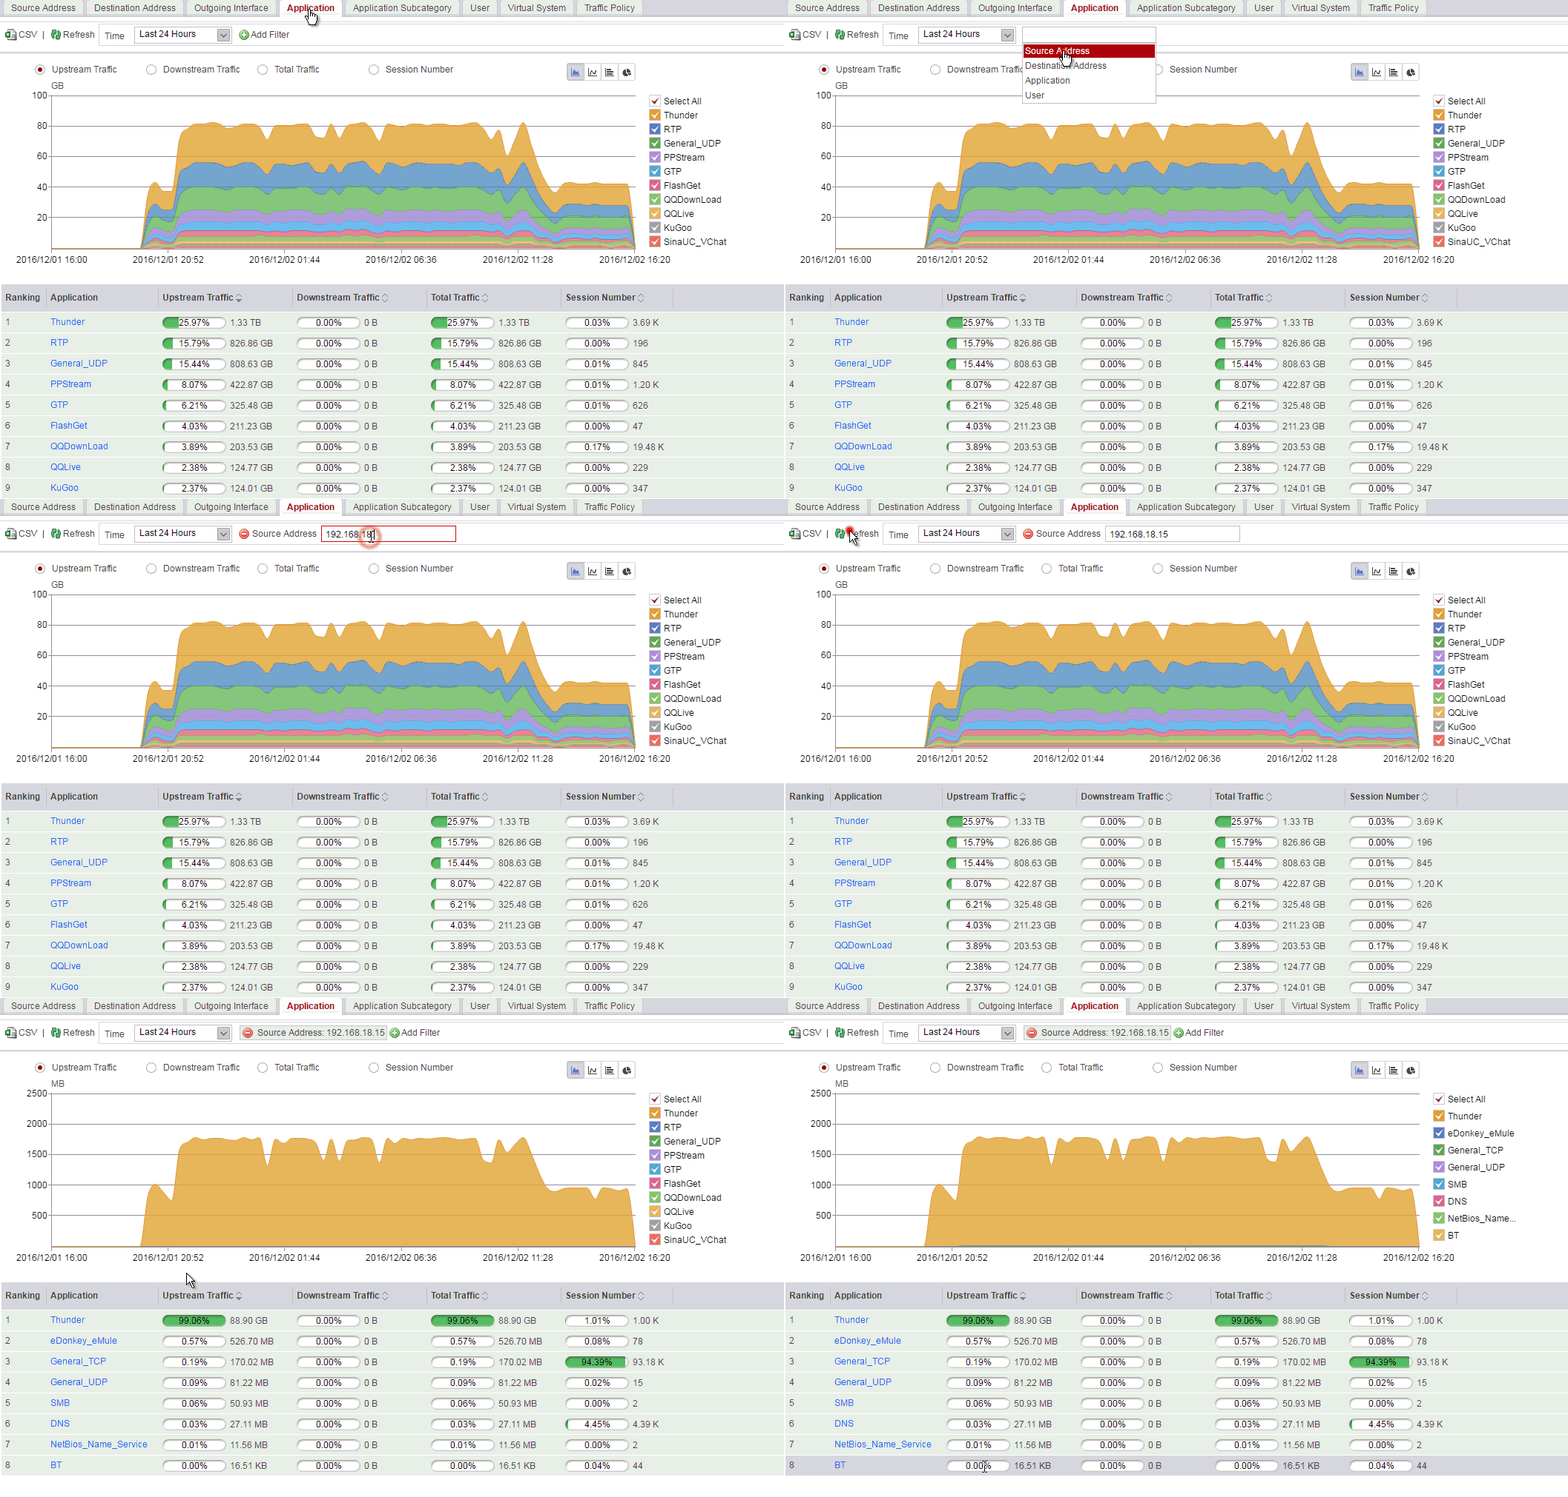
To narrow the search range when querying specific traffic statistics, you can specify one or more search conditions in Add Filter, and click Refresh to customize the generated reports.
For example, the following figure shows specific operations and displayed data for comparing traffic generated by source IP address 192.168.18.15 for accessing applications.
Drilling Traffic Statistics in the Source Address, Destination Address, or User Dimension
The traffic reports in the application category and application sub-category dimension do not support secondary drilling for traffic statistics.
You can drill the application dimension for certain traffic based on the source address, destination address, or user. To view traffic corresponding to a source address, destination address, or user, you can click a data link.
For example, if the volume of traffic for accessing a certain application is extremely high, you can view the user traffic trend corresponding to this application. The following figure shows the specific operations and displayed information.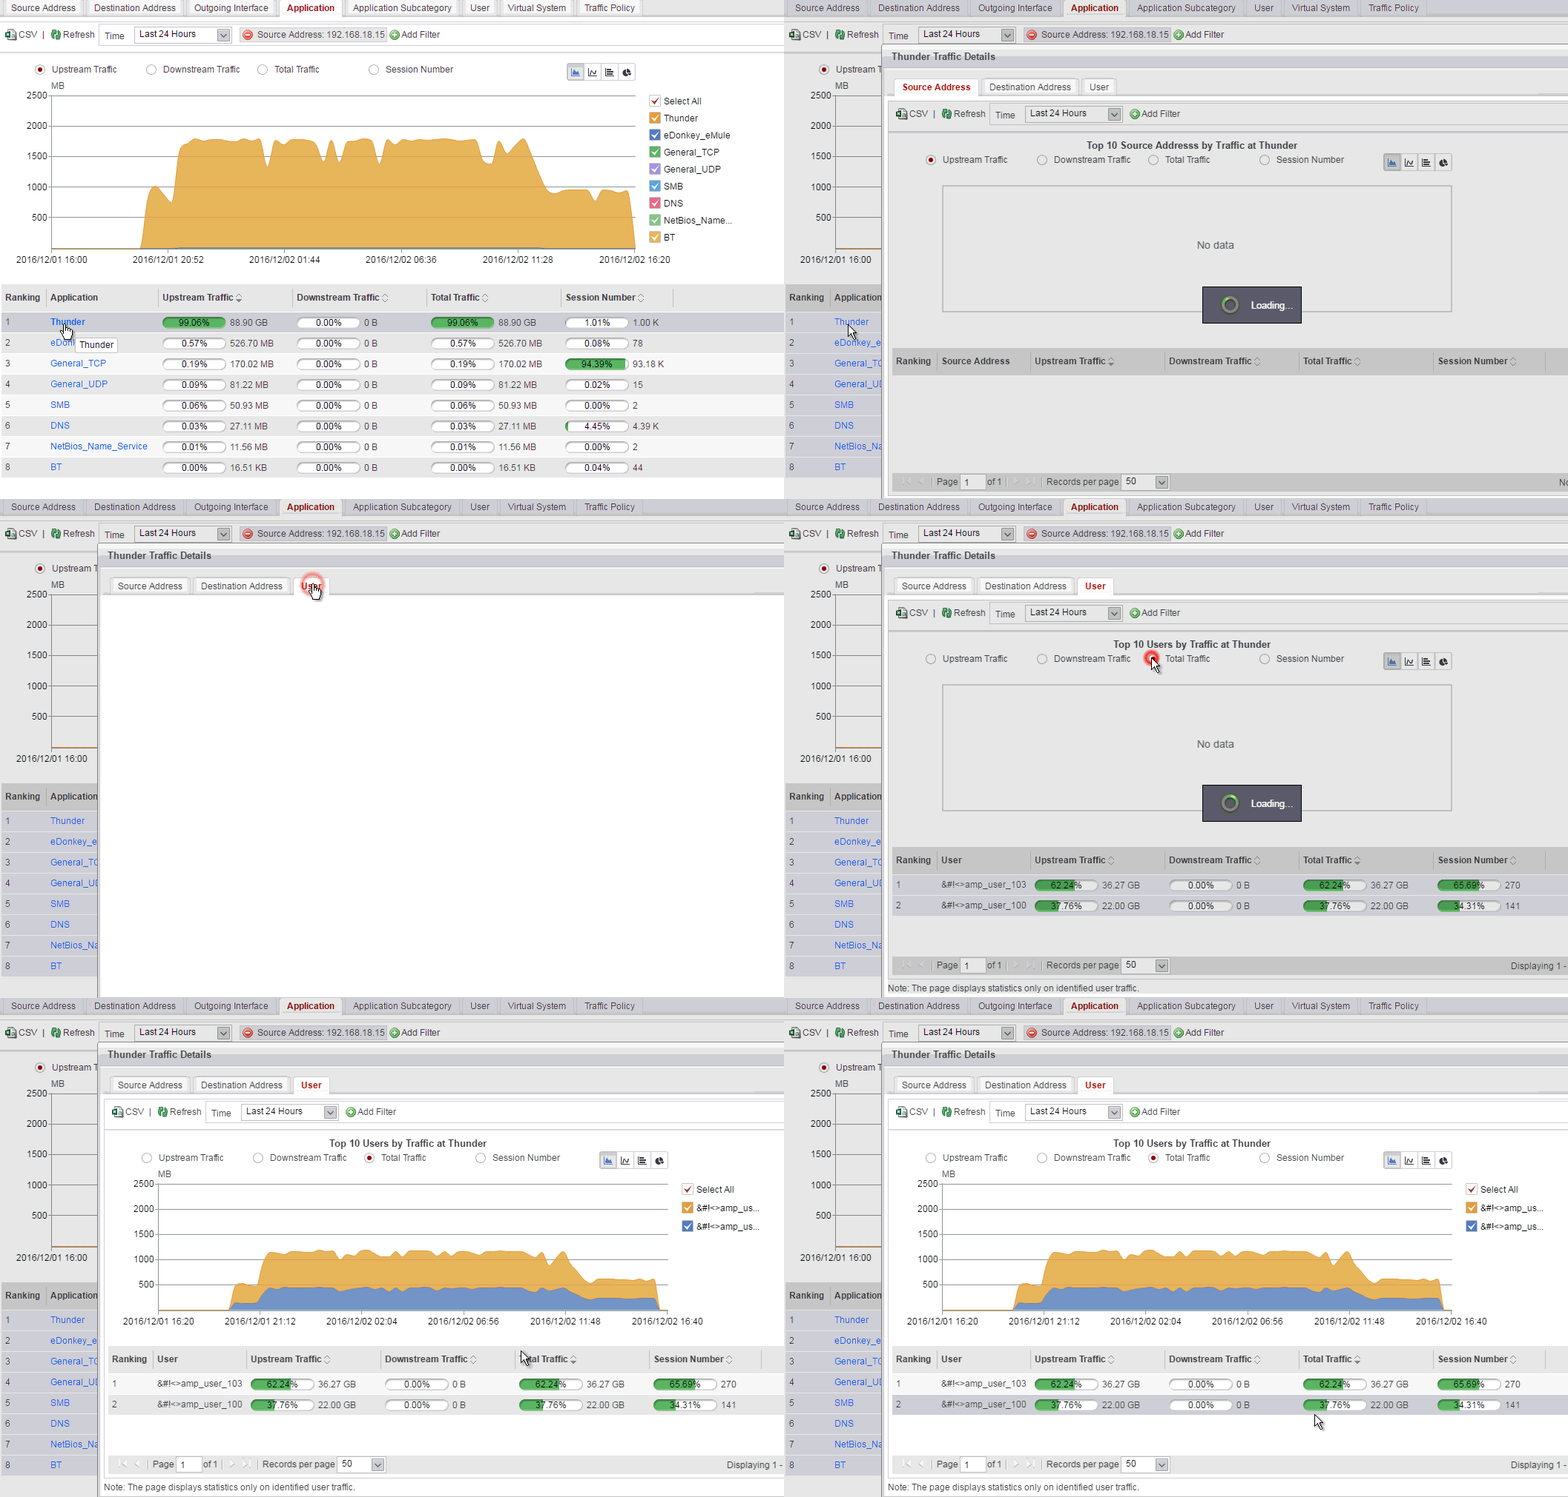
If the traffic of non-critical services such as P2P or online video is high and affects normal services, you can limit the traffic by setting bandwidth management policies, to ensure normal use of bandwidth resources.