Other Diagnosis Methods
This section describes the other diagnosis methods.
Web Page Diagnosis
Web page diagnosis provides information about failure in web page access.
- Choose .
- Click Web Page Diagnosis.
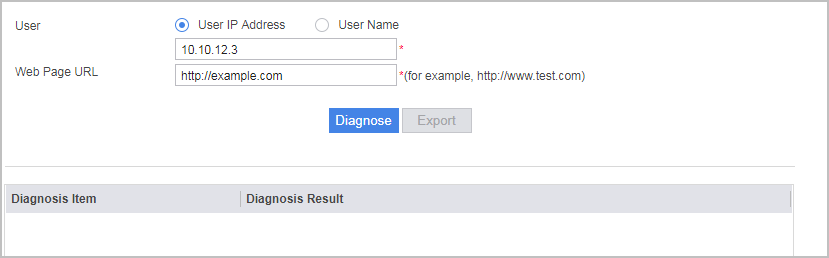
- Configure web page diagnosis.
Parameter
Description
User
- User IP Address: IP address of the intranet host that accessed the web page.
User Name: User name used by the intranet host to access the network.
The device allows the detection to a maximum of three IP addresses for a user name that can log in to multiple IP addresses.
NOTE:The user name-based web page diagnosis takes effect only for online users.
Web Page URL
URL address of the requested web page.
The format is http://, for example, http://www.example.com or http://www.example.com/default.html.
- Click Diagnose to obtain the diagnosis information.
- Optional: Click Export to export the diagnosis information to the default path.
Top N Sessions
By viewing top N session information, you can acquire information about top N source or destination IP addresses with the largest number of sessions in a timely manner.
- Click Top Sessions to view top N source or destination IP addresses with the largest number of sessions.
- Optional: Query top N source IP addresses that initiate the largest number of sessions on the specified virtual system and in the specified security zone on the Source Address tab.
- Click Advanced Search and enter filtering conditions.
- Click OK. Top N source IP addresses are displayed.
- Optional: Query top N destination IP addresses that initiate the largest number of sessions on the specified virtual system and in the specified security zone on the Destination Address tab.
- Click Advanced Search and enter filtering conditions.
- Click OK. Top N source IP addresses are displayed.
Routing Table
By viewing the routing table, you can quickly check the static or dynamic route configurations.
- Click Routing Table to view the routing information configured on the device.
- You can set filtering conditions, such as IPv4/IPv6 and Protocol, to query routes accurately.
Session Table
By viewing the session table, you can approximately locate the faulty module or phase.
- Click Session Table to view details about the session table.
- Click Add Filter and select query conditions to view session entries that meet the conditions.
For details about the session table, see Checking the Session Table Using the Web UI.
5-Tuple Packet Capture
By viewing 5-tuple packet capture information, you can quickly capture fault data and locate error packet or packet discarding issues to shorten the fault locating time.
- Click 5-Tuple Packet Capture to view detailed information about the captured packets.
- Click Configure Parameter, set parameters one by one, and click OK to reset packet capture.
For details about 5-tuple packet capture, see Configuring 5-Tuple Packet Capture Using the Web UI.
5-Tuple Packet Discarding Statistics
By viewing 5-tuple packet discarding statistics, you can learn about the forwarding or discarding of packets in a timely manner.
- Click 5-Tuple Packet Statistics to view detailed information about forwarded or discarded packets.
- Click 5-Tuple Packet Discarding Statistics, set parameters one by one, and click OK to reset statistics collection.
For details about 5-tuple packet discarding statistics, see Configuring 5-Tuple Packet Discarding Statistics Using the Web UI.
Security Policy
By using the security policy function, you can check whether the security policy is correctly configured and needs to be adjusted or optimized.
- Click Security Policy to view the security policies configured on the device.
- You can click Add Filter and enter different filtering conditions to accurately query security policy information.
- Click Add Security Policy or Add Security Policy Group to directly create a security policy or security policy group.
For details about the security policies, see Configuring a Security Policy Using the Web UI.
Interface Status
By viewing the interface status, you can check whether the interfaces on the device are correctly configured.
- Click Interface Status to view information about interfaces configured on the device.
- Select Interface List and enter the interface name to filter out the interface status information.
For details about the interfaces, see Interface Configuration Using the Web UI.